Description
Vineyard Wind 1 is the first commercial-scale offshore wind energy project in the United States that is being developed by Vineyard Wind, an offshore wind development company 50% owned by Copenhagen Infrastructure Partners (CIP) and 50% owned by Avangrid Renewables.
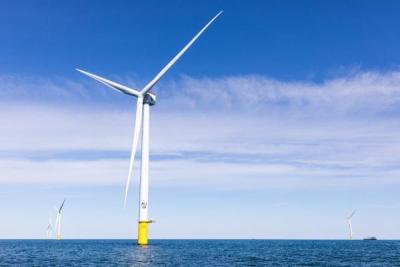
Vineyard Wind 1 will consist of an array of 62 wind turbines spaced 1 nautical mile apart on an east-west and north-south orientation. The turbines are General Electric Halide-X turbines, each capable of generating 13 megawatts (MW) of electricity. Electricity generated by the turbines will be collected by an offshore substation prior to being transmitted to shore. Vineyard Wind 1 is estimated to generate 800 MW of electricity annually and power over 400,000 homes, an equivalent of removing 325,000 vehicles from roadways.
Two submarine cables will be installed along a carefully sited route from the offshore substation to the landing point onshore at Covell’s Beach in Barnstable. Submarine cables are buried up to six feet below the seafloor using a jetplow. The route was selected after extensive geological surveys of the area to avoid sensitive habitats. The onshore cables will be buried beneath public roadways in Barnstable.
From the onshore cable landing site, the cables will be installed underground along public roads to an onshore substation in the village of Hyannis. The Vineyard Wind 1 onshore substation will be adjacent to an existing Eversource substation.
Location
Vineyard Wind 1 is located in federal wind energy area OCS-A-0501, 15 miles south of Martha’s Vineyard and Nantucket, and 35 miles from mainland Massachusetts. The location was determined through a multi-year, intergovernmental task force process, which carefully considered scientific data and public input. Two submarine cables were installed along a carefully sited route from the offshore substation to the landing point onshore at Covell’s Beach in Barnstable. The route was selected after extensive geological surveys of the area to avoid sensitive habitats.
Project Timeline
- 2025, May: The U.S. Supreme Court denied petitions from fishing industry lobbying group, Responsible Offshore Development Alliance (RODA) challenging the Vineyard Wind project
- 2025, January: BOEM approves COP revisions, and BSEE lifts its suspension order
- 2024, December: Revised COB submitted for review to remove blades from 22 turbines
- 2024, July: Blade failure resulting in the release of blade debris into the environment
- 2023, June: Offshore installation of turbines expected to begin
- 2022, October–November: Offshore cable installation
- 2021, May: BOEM releases Record of Decision (ROD). Onshore site preparation begins in Barnstable
- 2021, March: BOEM releases Final Environmental Impact Statement (FEIS)
- 2020, June: BOEM completes cumulative impact review and issues Supplement to Draft EIS
- 2020, Spring: State, regional, and local permitting completed
- 2019, May: State board EFSB approves Vineyard Wind 1 transmission
- 2019, February: Massachusetts Environmental Policy Act (MEPA) issues certification of Draft EIS
- 2018, December: Vineyard Wind submits FEIS to MEPA. BOEM issues Draft EIS. Vineyard Wind obtains second lease area, OCS-A-0522.
- 2018, April: Vineyard Wind submits plans for state review, initializing environmental review
- 2018, March: BOEM holds public meetings in advance of preparing an EIS
- 2017, December: Vineyard Wind 1 submits state and federal plans for Vineyard Wind 1 in lease area OCS-A-0501, including Construction and Operations Plan (COP) and transmission plans
- 2015, January: Department of Interior holds public auction for lease area OCS-A-0501, which Vineyard Wind obtains
- 2010-2014: Federal siting review for development of offshore wind energy on the outer continental shelf off the coast of Massachusetts and Rhode Island
Licensing Information
At the federal level, the lead permitting agency, the Bureau of Ocean Energy Management (BOEM), awarded the lease for Vineyard Wind in 2015 and in 2021, after the state, regional, and local permitting was completed issued the Final Environmental Impact Statement and Record of Decision. Several state and local authorities were involved in the project. At the state level, the Energy Facilities Siting Board approved the transmission cables and connection to the grid in Barnstable and the Massachusetts Environmental Policy Act Office issues the certification of its final Environmental Impact Report. Regionally, the Cape Cod and Martha’s Vineyard Commissions which reviewed and approved the Development of Regional Impact. Locally, the Towns of Barnstable and Edgartown which reviewed the onshore transmission and grid interconnection infrastructure plan to ensure compliance with the state’s Wetlands Protection Act.
Key Environmental Issues
- 2025, April: ACK for Whales filed a petition with the Interior Department and BOEM, asking the agencies to revoke the revised construction and operations permit they issued in January to allow the project to resume installation after the blade failure. The permit is required for Vineyard Wind to install and operate its project.
- 2025, March: ACK for Whales filed a petition with the U.S. Environmental Protection Agency, requesting the agency rescind the Clean Air Act permit it granted to Vineyard Wind to construct and operate its wind farm.
- 2025, March: Responsible Offshore Development Alliance (RODA) petitioned the U.S. Supreme Court to take their case and overturn the lower court’s rulings, but the Supreme Court rejected their petitions.
- 2025, February: The same turbine that broke in 2024 (A38) was hit by lightning. Aerial and vessel based investigations indicated no debris resulting from the lightening strike.
- 2024, July: One of the blades on a turbine (A38) in the southernmost end of the lease area broke and a large chunk of the blade fell into the water prompting an investigation by the Bureau of Safety and Environmental Enforcement (BSEE).
- 2019, January: Vineyard Wind 1 and the Natural Resources Defense Council, the National Wildlife Federation, and Conservation Law Foundation entered into a landmark agreement to protect critically endangered North Atlantic right whales. The agreement calls for restricting vessel speeds, limiting construction noise, work-stop measures, and no construction during migration season.
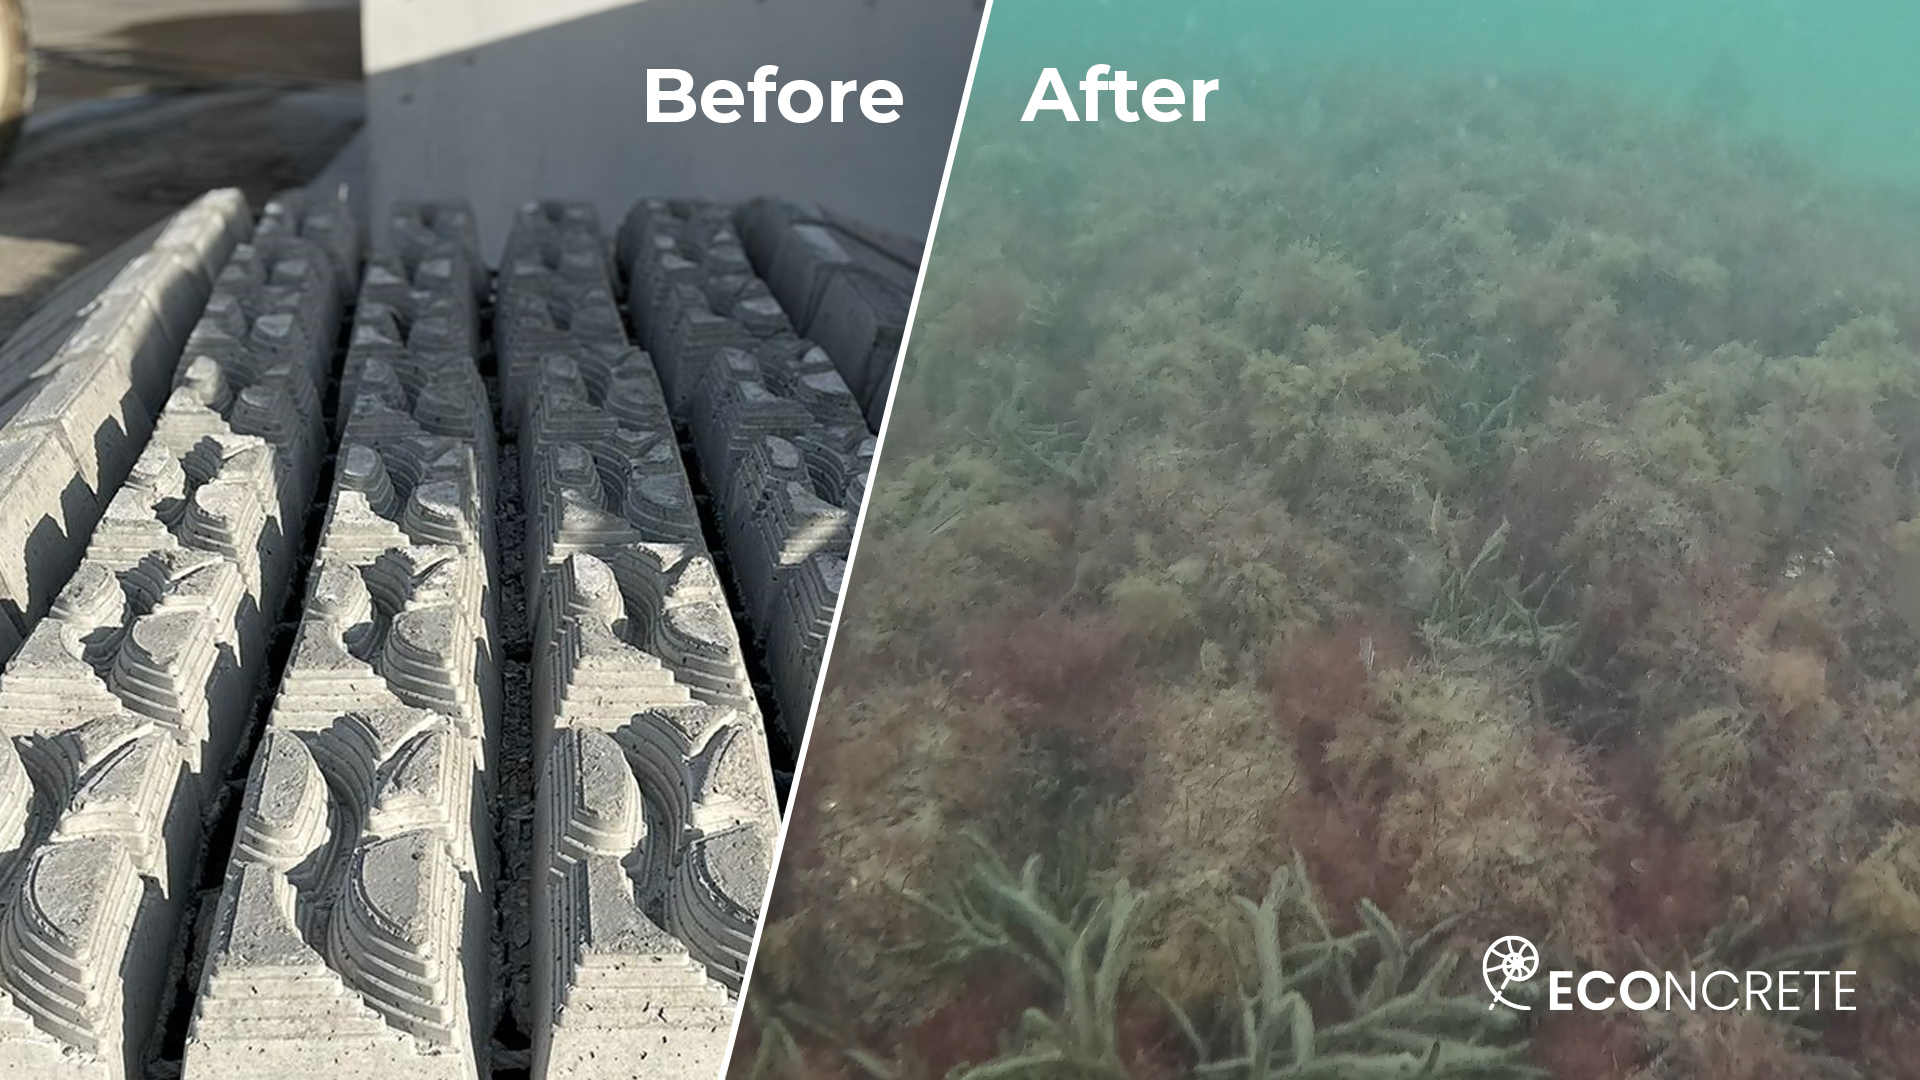
Environmental Papers and Reports
- Perceived misinformation in offshore wind: Insights from participants in Northeastern U.S. offshore wind planning and permitting processes (Howley et al. 2025)
- The presence, persistence, and movements of highly migratory pelagic fishes (HMS) in southern New England offshore wind lease areas from 2022-2023 determined by acoustic telemetry (Kneebone et al. 2025)
- Programmatic Framework Biological Assessment for New York Bight Leases (Bureau of Ocean Energy Management (BOEM) 2024)
- Vineyard Wind Demersal Trawl Survey 2023/2024 Annual Report (Rillahan and He 2024)
- 2023 Drop Camera Surveys of Benthic Communities and Substrate in the Vineyard Wind 1 Lease Area OCS-A 0501 and a Control Area (Stokesbury et al. 2024)
- Will wind development adversely impact North Atlantic right whales through an increase in vessel traffic? (Bishop 2024)
- Lobster Ventless Trap, Black Sea Bass, Plankton 2023 Survey Season Annual Report (Stokesbury et al. 2024)
- Vineyard Wind 1 Demersal Trawl Survey Winter 2024 Seasonal Report (Rillahan and He 2024)
- Vineyard Wind 1 Demersal Trawl Survey Fall 2023 Seasonal Report (Rillahan and He 2024)
- 2021/2022 Drop Camera Surveys of Benthic Communities and Substrate in the Vineyard Wind 1 Lease Area OCS-A 0501 and a Control Area (Stokesbury et al. 2023)
- Vineyard Wind 1 Demersal Trawl Survey Summer 2023 Seasonal Report (Rillahan and He 2023)
- Vineyard Wind 1 Demersal Trawl Survey Spring 2023 Seasonal Report (Rillahan and He 2023)
- Vineyard Wind Demersal Trawl Survey 2021/2022 Annual Report (Rillahan and He 2023)
- Larval Lobster and Fish Neuston Net Survey for Regional Fisheries Monitoring in Southern New England Offshore Wind Development (Stokesbury et al. 2023)
- Vineyard Wind 1 Demersal Trawl Survey Summer 2022 Seasonal Report (Rillahan and He 2022)
- 2020 Drop Camera Survey of Benthic Communities and Substrate in the 501N Study Area and an adjacent Control Area (Stokesbury et al. 2022)
- Lobster Ventless Trap, Black Sea Bass, Plankton 2021 Survey Season Annual Report (Stokesbury et al. 2022)
- Larval Lobster Abundance Survey of the VW1 Study Area 2021 Survey Season Annual Report (Stokesbury et al. 2022)
- Vineyard Wind Demersal Trawl Survey Winter 2022 Seasonal Report (Rillahan and He 2022)
- Vineyard Wind 1 Demersal Trawl Survey Fall 2021 Seasonal Report (Rillahan and He 2021)
- 2021 Review of Vineyard Wind 1 Fishery Resource Monitoring (Cadrin 2021)
- Vineyard Wind Demersal Trawl Survey 2020/2021 Annual Report (Rillahan and He 2021)
- Vineyard Wind 1 Demersal Trawl Survey Spring 2021 Seasonal Report (Rillahan and He 2021)
- Vineyard Wind 1 Construction and Operations Plan (Bureau of Ocean Energy Management (BOEM) 2021)
- Vineyard Wind 2020 Survey Season Annual Report: American Lobster, Black Sea Bass, Larval Lobster Abundance Survey, and Lobster Tagging Study of the 501N Study Area (Stokesbury et al. 2021)
- Lobster Ventless Trap, Black Sea Bass, Plankton 2020 Survey Season Annual Report (Stokesbury et al. 2021)
- Vineyard Wind 1 Final Environmental Impact Statement (FEIS) (Bureau of Ocean Energy Management (BOEM) 2021)
- Vineyard Wind 1 Demersal Trawl Survey Winter 2021 Seasonal Report (Rillahan and He 2021)
- Vineyard Wind 1 Demersal Trawl Survey Fall 2020 Seasonal Report (Rillahan and He 2020)
- Vineyard Wind 1 Demersal Trawl Survey Summer 2020 Seasonal Report (Rillahan and He 2020)
- Biological Opinion for Vineyard Wind's Offshore Wind Energy Project (National Marine Fisheries Service (NMFS) 2020)
- Vineyard Wind Demersal Trawl Survey 2019/2020 Annual Report (He and Rillahan 2020)
- Assessing Potential Impacts of Offshore Wind Facilities on Regional Sea Scallop Laval and Early Juvenile Transports (Chen et al. 2020)
- Vineyard Wind 1 Demersal Trawl Survey Winter 2020 Seasonal Report (Rillahan and He 2020)
- Vineyard Wind 1 Demersal Trawl Survey Fall 2019 Seasonal Report (Rillahan and He 2020)
- A comprehensive assessment of baseline recreational fishing effort for highly migratory species in southern New England and the associated Wind Energy Area (Kneebone and Capizzano 2020)
- Lobster Ventless Trap, Black Sea Bass, Plankton 2019 Survey Season Annual Report (Stokesbury et al. 2020)
- Vineyard Wind American Lobster, Black Sea Bass, Larval Lobster Abundance Survey, And Lobster Tagging Study of the 501N Study Area, 2019 Survey Season Annual Report (Stokesbury et al. 2020)
- Vineyard Wind 1 Demersal Trawl Survey Summer 2019 Seasonal Report (Rillahan and He 2020)
- Vineyard Wind 1 Demersal Trawl Survey Spring 2019 Seasonal Report (Rillahan and He 2020)
- 2019 Drop Camera Survey of Benthic Communities and Substrate in Vineyard Wind Lease Area OCS-A 0501 North and a Control Area (Bethoney et al. 2020)
- Takes of Marine Mammals Incidental to Specified Activities; Taking Marine Mammals Incidental to Construction of the Vineyard Wind Offshore Wind Project (National Oceanic and Atmospheric Administration (NOAA) 2019)
- 2019 Vineyard Wind Fishermen Scoping Workshops Report (Cadrin et al. 2019)
- Recommendations For Planning Pre- And Post-Construction Assessments Of Fisheries In The Vineyard Wind Offshore Wind Lease Area (Cadrin et al. 2019)
- 2018 Vineyard Wind Groundfish Bottom Trawl Survey (Stokesbury and Lowery 2018)
- Flight Activity and Offshore Movements of Nano-Tagged Bats on Martha’s Vineyard, MA (Dowling et al. 2017)
- Abundance and Distribution of Seabirds off Southeastern Massachusetts, 2011-2015 (Veit et al. 2016)
NOAA Fisheries has developed Offshore Wind Lease Reports that summarize previous fishing activity within each offshore wind lease area along the U.S. Atlantic Coast. View Descriptions of Selected Fishery Landings and Estimates of Vessel Revenue from Areas: A Planning-level Assessment and Descriptions of Selected Fishery Landings and Estimates of Recreational Party and Charter Vessel Revenue from Areas: A Planning-level Assessment for Vineyard Wind 1 (OCS-A-0501) here.
Additional project documents are available on Vineyard Wind's website.
View educational resources and videos on Vineyard Wind's Education page.
Environmental Monitoring: Vineyard Wind
| Phase | Stressor & Receptor | Design and Methods | Results | Publications | Data |
|---|---|---|---|---|---|
| Baseline | Bats | Telemetry Five northern long-eared bats, three eastern red bats, two big brown bats, and three little brown bats on Martha’s Vineyard were tagged with radio tags and tracked over 5-39 nights. | Complete No offshore movements were recorded for long-eared bats. Offshore movement was recorded for the little brown bats and eastern red bats, indicating equipment could detect offshore movement. | Dowling et al. 2017 | No data publicly available |
| Baseline | Birds | Aerial survey 38 aerial surveys of seabirds south of Nantucket and Martha’s Vineyard, MA, were completed between 22 November 2011 and 14 January 2015. | Complete Two “Hotspots” of seabirds were identified – near the western edge of the Nantucket Shoals (Long-tailed Ducks and White-winged Scoters in winter, Common and Roseate Terns in spring), and in the Muskeget Channel area (scoters, eiders, loons, and terns). | Veit et al. 2016 | No data publicly available |
| Baseline | Fish | Trawl Survey
One trawl tow was made in each of 20 sub-areas within the lease area. The same subdivision was applied to a control area of equal size. Trips were made in January and February 2022, and were conducted during daylight hours. A total of 160 tows were completed throughout four seasonal trawl surveys in the 2020/2021 survey year. 20 surveys each per season were performed in the survey area and a control area. A total of 160 tows were completed throughout four seasonal trawl surveys in the 2019/2020 survey year. 20 surveys each per season were performed in the survey area and a control area. |
Complete
19 species were caught in the study area over the duration of the survey. The five most abundant species (Atlantic herring, little skate, Atlantic cod, alewife, and longhorn sculpin) accounted for 97.8% of the total catch weight. The five most abundant species (little skate, scup, spiny dogfish, winter skate, and silver hake) accounted for 77% of all species observed in the control area and 78% in the study area. The four most abundant species (spiny dogfish, little skate, silver hake, and red hake) accounted for 78% of total catch weight in the study area and 71% of total catch weight in the control area. |
Rillahan and He 2022, Rillahan and He 2021, He and Rillahan 2020, Rillahan and He 2024, Rillahan and He 2023, Rillahan and He 2024, Rillahan and He 2024, Rillahan and He 2023, Rillahan and He 2023, Rillahan and He 2022, Rillahan and He 2021, Rillahan and He 2021, Rillahan and He 2021, Rillahan and He 2020, Rillahan and He 2020, Rillahan and He 2020, Rillahan and He 2020, Rillahan and He 2020, Rillahan and He 2020 | No data publicly available. |
| Baseline | Fish | Tagging (Acoustic telemetry and conventional tags)
Fishermen were surveyed between August 2019 and March 2020 investigating their fishing methods in the survey area. Also CTD tagging data and responses to the National Marine Fisheries Service Large Pelagics Intercept Survey from 2002-2018 were compiled and analyzed. Spatiotemporal use was studied with passive acoustic telemetry via an array of acoustic receivers deployed from January 1, 2022 to December 31, 2022 (n = 75 receivers) and from January 1, 2023 to December 31, 2023 (n = 73 receivers). A total of 259 acoustic transmitters were deployed on 10 species, including blue shark (n = 86), bluefin tuna (n = 70), common thresher shark (n = 3), dusky shark (n = 12), little tunny (n = 1), sandbar shark (n = 3), shortfin mako (n = 50), smooth hammerhead (n = 1), spinner shark (n = 2), and yellowfin tuna (n = 31) in and around the WEA during summer 2020 (n = 29), 2021 (n = 69), 2022 (n = 70), and 2023 (n = 91). |
Complete
A total of 12,537 and 2,313 tagging events occurred from 2002-2018 in two survey areas. The majority of tagging events were blue sharks (~70%) and bluefin tuna (~20%). Survey results show within the Vineyard Wind lease area, fishermen target bluefin tuna, shortfin mako, and ‘any tuna species’ with trips originating primarily from Massachusetts and Rhode Island. During 2022 and 2023, 164 of the 259 total tagged individuals were detected by the receiver array, including 144 of the 199 individuals tagged by developer-funded efforts and 20 of the 60 individuals (4 blue sharks, 10 bluefin tuna, 5 shortfin mako, and 1 smooth hammerhead) tagged in 2020 and 2021 during a pilot study funded by MACEC. A total of 33,098 detections were recorded over all individuals with multiple cases of fish detected in years subsequent to tagging. Tagged HMS inhabited the WEA during the warmer months of the year; blue sharks, bluefin tuna, and shortfin mako were the earliest species to arrive in June of both years, while bluefin tuna were the last species to depart in January 2023 and December 2023. Complete emigration occurred by mid-winter as no detections were logged from January through May 2022 and February through May 2023. |
Kneebone et al. 2025, Kneebone and Capizzano 2020 | No data publicly available |
| Baseline | Fish, Invertebrates | Lobster Ventless Trap, Black Sea Bass, Plankton Surveys
The University of Massachusetts Dartmouth School for Marine Science and Technology (SMAST) and Massachusetts Lobstermen’s Association conducted a standardized ventless lobster trap survey and tagging study in Vineyard Wind's Lease Area and an adjacent Control Area. Populations of adult and larval American lobster (Homarus americanus), and black sea bass (Centropristis striata) were sampled and compared between the Study Area and Control Area. This project identified baseline conditions in the Vineyard Wind Study Area and adjacent Control Area, which contributed to an eventual Before-After-Control-Impact (BACI) design to detect patterns of difference. The primary objectives were to estimate the size and distribution of lobster and black sea bass populations; quantify aspects of the life history of these two species such as length, sex, reproductivity success, age, diet, and disease prevalence; estimate the relative abundance and distribution of planktonic species, such as larval lobster, in the neustonic layer of each area, using a towed ichthyoplankton net at each survey location; and obtain movement patterns of adult lobsters through a tagging study. For the lobster, black sea bass, and planktonic sampling locations, random sampling design was employed by stratifying the area of interest using existing lease blocks. Lease blocks within the two study areas, the VW1 Study Area and adjacent Control Area, were divided into smaller sub-areas called aliquots. Within each lease block, an aliquot was randomly selected to serve as a sampling site throughout the survey season. Fifteen sampling sites were selected in each of the Study Area and Control Area, for a total of 30 stations. Each sampling site was sampled two times per month from May to October 2023 using a string of seven traps. On each string, six ventless traps were alternated with standard vented traps to compare differences in catch rates and size selectivity between trap types. A single, unbaited sea bass pot was also attached to one end of each string. Surface plankton tows were conducted twice per month from May to October. |
Complete
In 2023, 431 lobsters were sampled: 248 in the Study Area (average size 93.3 ± 1.2 mm) and 183 in the Control Area (average size 89.8 ± 1.4 mm). The male:female ratio was 1.4:1 in the Study Area and 1.6:1 in the Control Area. A total of 523 black sea bass were sampled: 118 in the VW1 Study Area and 405 in the Control Area. The average length of black sea bass was 28.51 ± 0.96 centimeters (cm) in the Study Area and 29.78 ± 0.53 cm in the Control Area. A total of 44 lobster larvae were collected ranging from stages one to four: 32 in the Study Area and 12 in the Control Area. Average larval lobster density was 0.10 ± 0.05 larvae/1,000 m3 in the Study Area and 0.04 ± 0.03 larvae/1,000 m3 in the Control Area. A total of 4,847 Jonah crabs were caught: 3,266 caught in the Study Area and 1,581 in the Control Area. In 2021, 7 larval lobster samples were collected. Average larval lobster density was 0.035 larvae/1,000 m3 in the development area and 0.031 larvae/1,000 m3 in the Control Area. The four sampling periods were completed in May and June 2021. American lobster, black sea bass, and lobster tagging was not completed in 2021. In 2020, 921 lobsters were sampled: 662 in the Study Area (average size 87.24±0.73 mm) and 259 in the Control Area (average size 93.65±1.19 mm). The male:female ratio was 2.4:1 in the Study Area and 4.2:1 in the Control Area. A total of 456 black sea bass were sampled: 149 in the Study Area and 307 in the Control Area. A total of 91 total lobster larvae ranging from stages two to four were collected. Average larval lobster density was 0.29 larvae/1,000 m3 in the development area and 0.09 larvae/1,000 m3 in the Control Area. A total of 3,828 Jonah crabs were caught, with 2,578 sampled in the Study Area and 1,250 in the Control Area. In 2019, 351 lobsters were sampled: 214 in the Study Area (average size 90.75 ± 2.2 mm) and 137 in the Control Area (average size 91.25 ± 2.4 mm). The male:female ratio was 1.6:1 in the Study Area and 2.4:1 in the Control Area. A total of 264 black sea bass were sampled: 99 in the Study Area and 165 in the Control Area. A total of 23 total lobster larvae ranging from stages two to four were collected. Average larval lobster density was 0.07 larvae/1000 m3 in the development area and 0.04 larvae/1000 m3 in the Control area. A total of 1,918 Jonah crabs were caught, with 1,160 sampled in the Study Area and 758 in the Control Area. The dominant substrate was shown to be sand with a few areas of gravel in both the Study Area and Control Areas. |
Stokesbury et al. 2024, Stokesbury et al. 2022, Stokesbury et al. 2021, Stokesbury et al. 2020 | No data publicly available. |
| Baseline | Invertebrates | IBM modeling An FVCOM ocean model was developed for the lease area and coupled with a Scallop-IBM model. | Complete Scallop Larval settlement show significant interannual variability. Large amounts of larvae were found to settle near the lease area when modelling the year 2010. | Chen et al. 2020 | No data publicly available. |
| Baseline | Invertebrates, Physical Environment | Drop Camera A centric systematic sampling design was used to survey stations with the drop camera in the Lease/ Study Area and an adjacent Control Area. Stations in the two areas were placed 1.5 kilometers (km) apart following a grid design. At each station, a sampling pyramid was deployed and a high-resolution camera was used to take four quadrat (2.3 square meter images) samples. Both areas were surveyed multiple times per year using a commercial scallop fishing vessel to deploy the sampling pyramid. The survey activities occurred while wind farm construction activities were taking place in the VW1 Study Area. | Complete
The benthic communities in the Study Area and Control Area were dominated by benthic invertebrates such as sand dollars, hermit crabs, waved whelks (Buccinum undatum, not the commercially harvested channeled whelk, Busycotypus canaliculatus), anemones, crabs (cancer spp.), and burrowing species. The vertebrates included in the dominant benthic community were skates, silver hake, and red hake. The density of the dominant benthic animals found in the Study Area and Control Area were similar. Whelk and squid, which had higher densities in the Control Area in the fall compared to the summer of 2023. There was an increase in the amount and frequency of all animal taxa from 2021 to 2022. Hermit crabs, which had a higher density in the Study Area in 2021 and a higher density in the Control Area in 2022. Waved whelks which had a higher density in the Control Area during July 2019 and August 2020. The benthic community of the Study Area and Control Area were most similar to each other, compared to the selected broader regions of the U.S. Outer Continental Shelf. The substrates in the Study Area and Control Area were dominated by sand with sparse gravel, with no cobble or boulders were observed. The substrate within trap survey aliquots was entirely comprised of sand, but the aliquots in the northwest part of the Impact Area contained gravel. |
Stokesbury et al. 2022, Stokesbury et al. 2024, Stokesbury et al. 2023, Bethoney et al. 2020 | No data publicly available. |
| Baseline | Marine Mammals | Literature Review, modeling Existing documentation of Marine mammals appearing in the US Atlantic EEZ is compiled, and the species are along listed with their special status, likelihood of occurrence in project area, seasonality, and abundance. | Complete 26 marine mammals are identified with varying likelihoods of occurrence. 16 species are identified as not likely to occur. | National Oceanic and Atmospheric Administration (NOAA) 2019 | |
| Baseline | Marine Mammals, Reptiles | Modeling The JASCO Animal Simulation Model Including Noise Exposure was used to predict probability of exposure of marine mammals and sea turtles to sound arising from Vineyard Wind’s pile driving operations. | Complete The number of marine mammals exposed to pile driving noise are identified for conservative, average, and maximum attenuation scenarios. Additionally, mitigation strategies such as seasonal restrictions and sound reduction technology are proposed. Expected exposure of several species of sea turtle to injury caused by noise was identified for conservative, average, and maximum attenuation scenarios. | Pyć et al. 2018 | No data publicly available. |
| Baseline, Construction | Habitat Change Marine Mammals |
Spatiotemporal vessel density analysis AIS data on vessel activity from 2015–2023 were collected and analyzed, focusing on the Vineyard Wind lease area. Monthly rasters were created to assess vessel density changes around completed turbines during construction phases. Spatial analysis captured localized density changes near turbines. Seasonal vessel density variation and comparisons across vessel categories were examined. | Ongoing Construction led to a modest vessel density increase (+6.82 monthly hours). Density changes were highly localized to turbine sites and did not extend significantly to other areas within the lease site. Seasonal peaks occurred in the summer, with density returning to near-zero by late fall. Results suggest limited long-term stress to right whales during Vineyard Wind construction phases. Scale of the project did not correlate to increased vessel density, likely due to larger turbines requiring extended installation time and dispersed vessel coverage. Further analysis is needed post-construction to confirm findings. | Bishop 2024 | No data publicly available. |